Inflation—Deflation
The Model

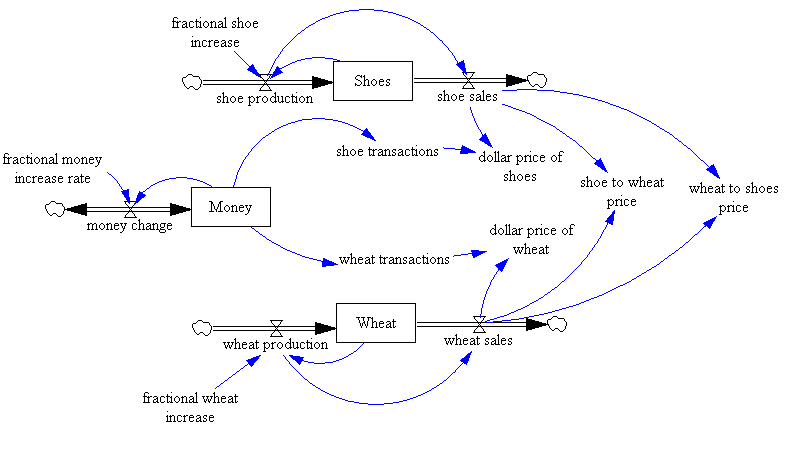
I created the figure below using the system dynamics software, Vensim. I started with the "stock and flow" diagram you see here; then using mathematical formulas embedded in the diagram it generates the "behavior over time" charts that you will see in pages that follow.

I will not describe the development of the "stock and flow" diagram model here, but I have given the important assumptions for this model on the previous page.
Inflation-Deflation

Important Distinctions

Although I have not gone into the detail of the development of the "stock and flow" diagram model, the distinction between flows and stocks have significance to the descriptions on the following pages.

Flows (Rates)
Flows (frequently referred to as "rates") consist of the amount of change of a stock (see stocks, below) over a specific period of time—in the case of this model that period equals a month. Any point on a behavior over time chart generated by this model the flow equals the amount of change (at a given rate) at that instance in time, e.g. shoes/month or wheat/month. Remember that flows occur in units per period, not percentages (see fractional rates).
Production
I have used the word "production" to denote the flow that increases the stock of Shoes or Wheat.
Sales
I have used the word "sales" to denote the flow that decreases the stock of Shoes or Wheat.
Money Change
Unlike the flows of production and sales the flow "money change" both increases and decreases the stock of Money. A flow that increases the stock of Money creates inflation. A flow that decreases the stock of Money creates deflation.
Fractional Rates
Fractional rates refer to the percentage (or fractional) increases in flows (rates). In these models production increases as a fraction of the current stock. For example, the "interest rate" you receive on a savings account actually amounts to a fractional interest rate. The bank adds a fraction of your account balance to the amount of interest paid in the last period.
Production Increase (Decrease)
Production increases by a fraction of the current stock (of shoes or wheat). (A negative increase would amount to a decrease.)
Money Supply Increase (Decrease)
Money change (inflation or deflation) increases by a fraction of the current stock of money. (Again a negative increase would amount to a decrease.)
Stocks (Levels)
Stocks consist of the amount of units (of Shoes, Wheat, Money, or Prices) that exist in the system at a point in time. Although prices represent a ratio calculated from two flow, they still consist of a stock because they are not dimensioned in time. (i.e. each price occurs at only one point in time.
Commodity Prices
Shoes/Wheat prices equal the ratio of shoe sales (in pairs per month) to wheat sales (in bushels per month). Wheat/Shoes prices equal the ratio of wheat sales (in bushels per month) to shoe sales (in pairs per month).
Dollar Prices
Dollars/Wheat prices equal the ratio of the amount of money (half the total) spent each month to the sales of wheat (in bushels).
Dollars/Shoes prices equal the ratio of the amount of money (half the total) spent each month to the sales of shoes (in pairs).
 

I have provided this detail so you can better understand the charts on the following pages. Just keep in mind the one important distinction:

  • Stocks (levels) show amounts at points in time.
  • Flows (rates) show the amount of change over a period of time.

In the next section we will examine direct exchange—one good exchanged for another.