![]()
The Free Market Center
![]()
The Free Market Center
| Shoe Production Fixed | 0.00%/Month |
| Wheat Production Fixed | 0.00%/Month |
This first step in direct exchange creates a base for the rest of the direct exchange examples. In order to understand what happens when production changes, we must first see what happens when production does not change.
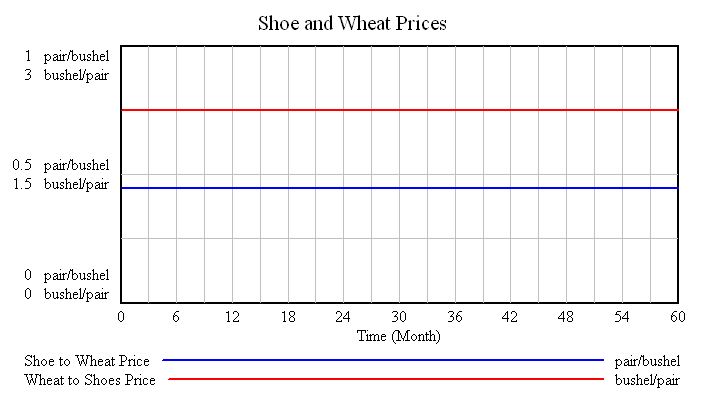
Since production for neither of these two products increases for the duration of this model the prices (exchange ratios) do not change.
The wheat producer receives 0.44 pair of shoes for each bushel of wheat.
The shoe maker receives 2.25 bushels of wheat for each pair of shoes.
Notice: each exchange ratio equals the reciprocal of the other:
1/2.25 = 0.44
1/0.44 = 2.25
© 2010—2020 The Free Market Center & James B. Berger. All rights reserved.
To contact Jim Berger, e-mail:
Before I continue, it might help to explain the organization of these charts.
The legend at the bottom of the chart indicates which line represents which variable. (Match the color on the chart with the color in the legend.) It also indicates the unit used for that variable.
On the chart the bottom (X) axis indicates time in months, from 0 through 60. On the vertical (Y) axis, each variable has its own scale. The order of the scales for the variables coincides with the order in which they appear in the legend.
You should find this quite straightforward on this chart, but it may get a little confusing with charts in which variables change over time.